

When I first started at my current workplace, I was told one of my responsibilities would be to move forward with automating our regression testing with VRTs. I had no idea what they were, or how they were implemented. Even after looking at documentation about them, I still felt lost. Whenever people talked about them, it was in a way that made them seem really difficult and a pain in the butt.
This made me really afraid to start on them. In fact, when we made our first batch of VRTs, I wasn’t involved at all. A developer wrote them, and when I asked if I could pair with him or take a look, he said that I should just wait until they were done and he would walk me through them afterwards. Considering that I had a manager who was supposed to be in charge of implementing our automation process but didn’t even know anyone was working on an automated test, and that I was a Junior – I felt I had no right to put my foot down about it at the time.
I thought I would have only slowed down the process with my lack of understanding, annoying a developer I barely knew with my presumption and overbearing or entitled attitude. I know now that it would have been fine. It’s okay to slow down ticket progress if it means knowledge can be shared, especially with people who should have that knowledge in the first place. We’ve definitely moved further towards that since then.
What is Visual Regression Testing?
When we make a change to our code, it can sometimes have consequences we don’t expect. For example, changing the font on a button could mean that in certain circumstances the text wraps differently, making the button taller and on a certain page the button partially covers some important text. This would be a regression bug.
It might not necessarily be caught during testing of the original change. A QA might simply look at the button, check the font and confirm that it has changed and is applied correctly on a few different pages.
This is why we have Regression testing, to catch regression bugs. When done manually, this is either a full or partial (smoke) test of the environment it was deployed to, to check for randomly introduced errors. Some we have found recently that got through to production were: terms text stops wrapping correctly so that it dissappears off the side of the product; button missing on a certain configuration of a certain type of product for all clients; and a button increasing in size when three specific criteria were met for one client only.
The problem with manual regression testing, and the reason so many get through the net, is that it takes a really long time. Especially if like us you have a complex product that has multiple configurations, as well as client-specific functionality and skinning options. We release to production on average three times a week. In order to do a full sweep of our front-end products I would need an entire day each time.
That’s where automation comes in. If I can write a test or series of tests then the computer can do all the checking for me, and tell me when anything has changed. A computer can also go through all the products much faster than I can manually. This is why the writing of automated Visual Regression Tests is on our priority list for next quarter.
The Visual in VRT means that the tests will use images to check for inadvertent changes to the product. This is done by taking screenshots of the product before any changes have been made and keeping those as a baseline, then taking new screenshots after deployment (or on a local dev environment) to compare with. Failed tests mean that there is a difference between screenshots, and you can look at them to see this diff highlighted. This is useful because it allows you not only to know that there is a difference, but to see it with your own eyes as if you had spotted it in the wild so that it can be flagged correctly as a bug. That, or the change is legitimate so can be ignored. You can then update the test so that the second lot of screenshots are the new baseline against which you will test in the future.
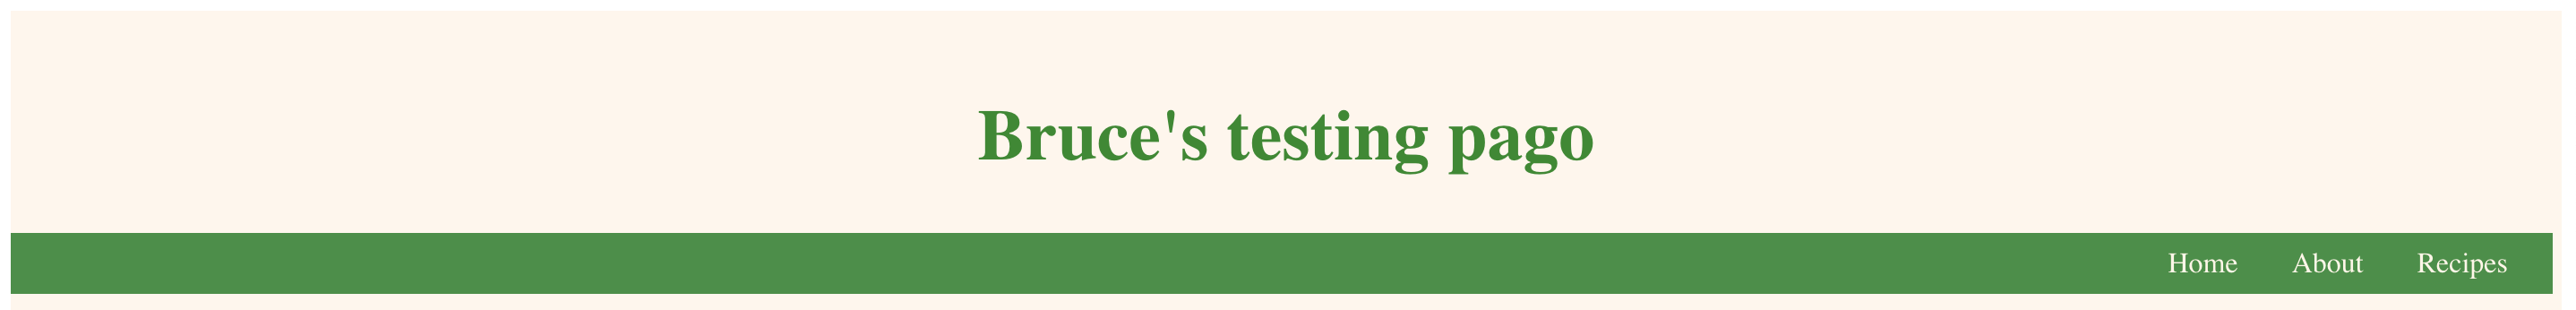
In this post, I’m showing how I wrote a test for checking changes to the above header on my testing page.
Visual regression testing with Gemini
If we wanted to make our own visual regression tool from scratch, this would be really combersome a task (although I plan to do something with Puppeteer in the future). Luckily, some frameworks already exist for this that are very well supported. The one that seems most popular is Gemini, which takes a screenshot of a webpage or part of one, then takes a new screenshot when you run a command (or automatically as part of your CI) and compares the two. If anything has changed, the test will fail and you can check the difference to see if it’s a legitimate change or a regression bug. This should catch any accidental changes when you deploy new code.
You can find quick-start and in-depth instructions for how to set up gemini in your project in the readme here, so I won’t go into too much depth about that. In this example, I’m using the express project I made in the last blog post.
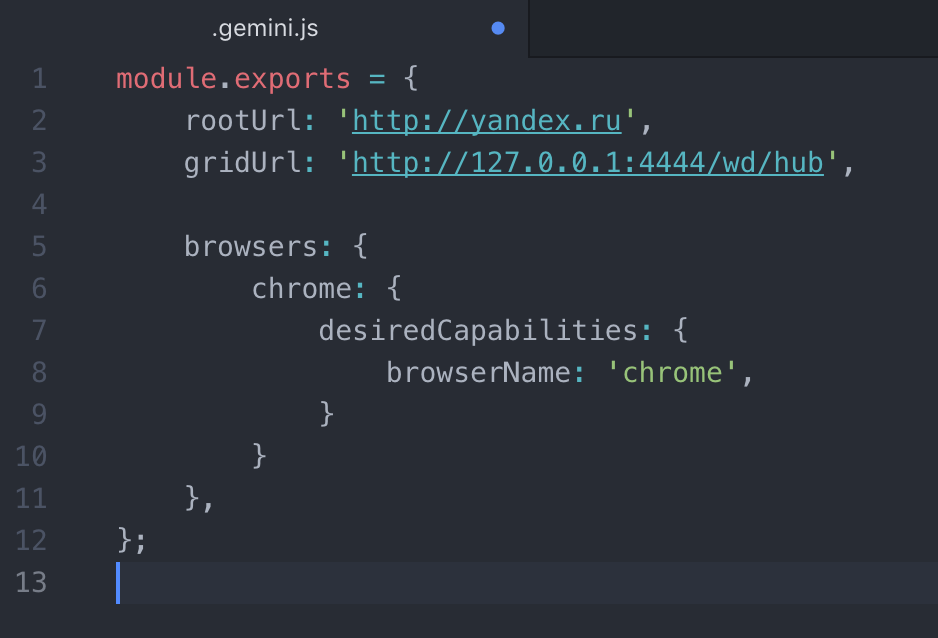
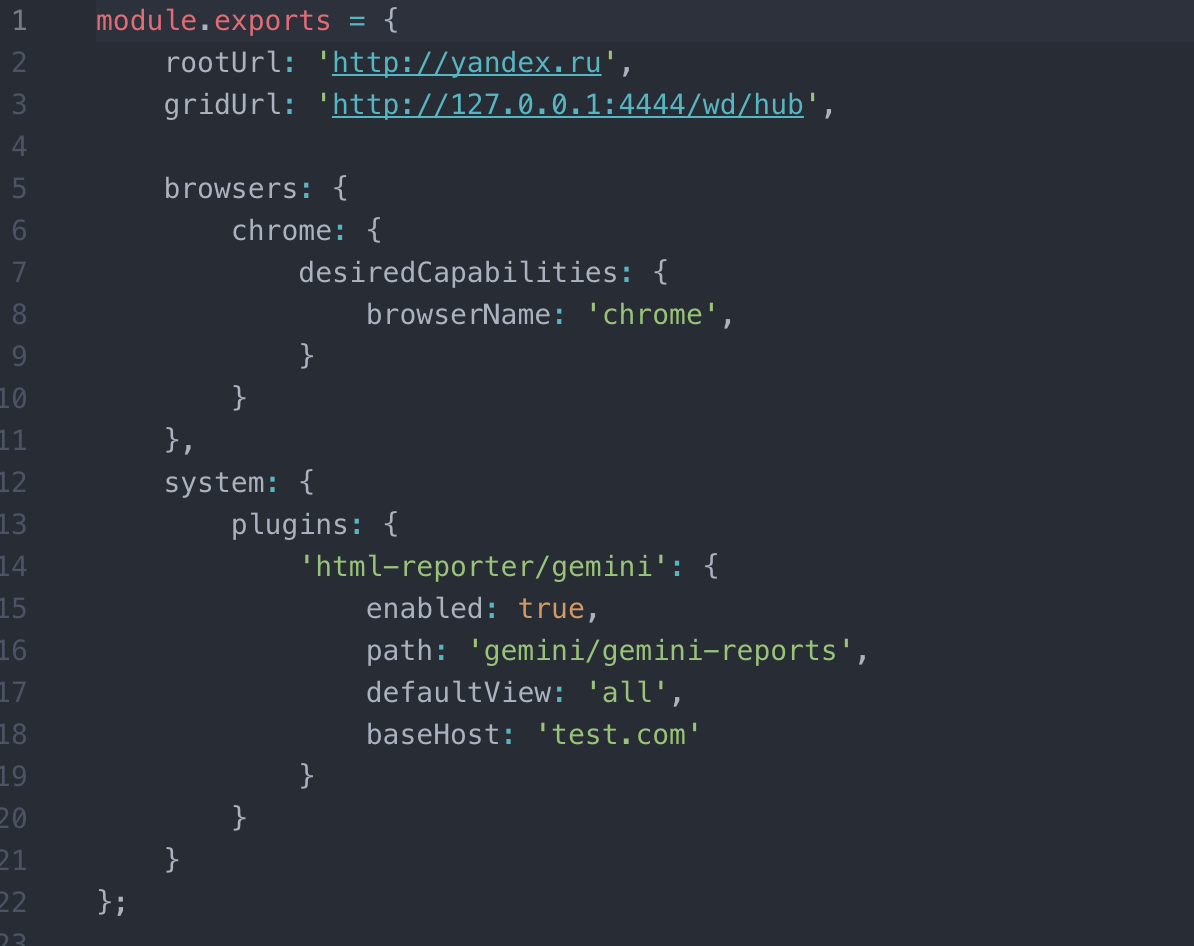
Read the readme in the Gemini repo linked above, and follow the install and configuration instructions. The quick start guide says to use a .gemini.js file but you can use other formats such as yml if you prefer. If you’re used to working in javascript, then .gemini.js is probably best. Simply create the file in the root of your project and copy-paste the text in, as below.
Now you’re all set up for writing a test! I found the syntax of the tests difficult to follow, but playing about gets ok results so long as you follow the documentation on test writing. After messing around for a few hours, I’ve got a much better idea.
First off, you need to know what you want to test. Start out with a small part of something, then work your way up. You can get gemini to find divs and hover or click on them.
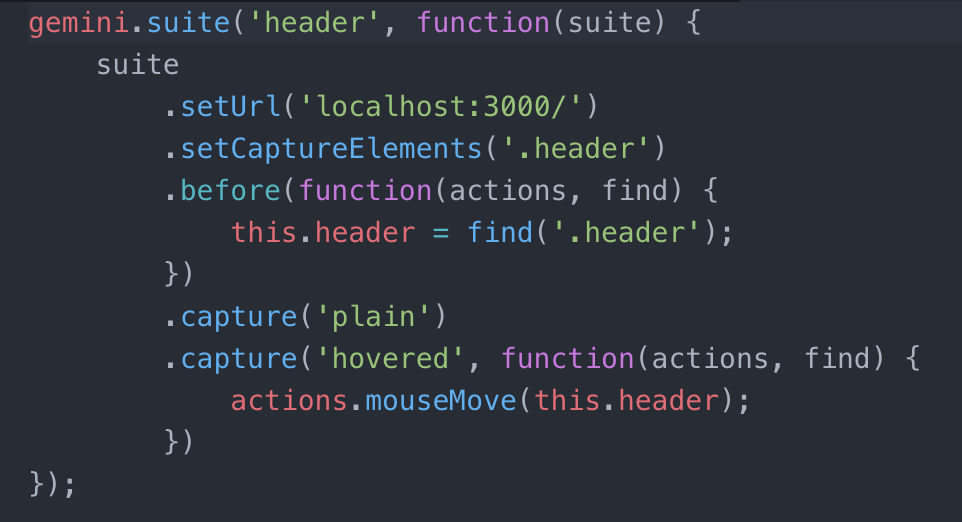
This is the test that I wrote. I basically copy-pasted something from the gemini documentation and played around with it to see what changes would break or do what I wanted. I’d recommend this as a starting point, because it’s one thing to read about what each line does, and another thing to really understand. Having said that, I’ll go through it as best I can.
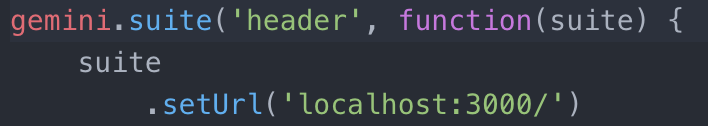
The first line defines your test. ‘header’ is the name of the test. Be careful to use different names for different tests, since this defines where the screenshots go. I made a second test and forgot to change the name, which meant that every time I updated the screenshots it would overwrite what I had for the first test. After the name, there is a function that takes in the parameter “suite”, which is basically everything inside the function. It needs .seturl(‘your site url/’) to tell it what site to open in the testing browser. I’ve set mine to localhost:3000, so the app needs to be served with node for this test to run.
When I first started, these two lines confused me. They looked like they did the same thing. They both set what you capture so it’s just needless duplication, right?
Wrong. Well, if you want to run an action on the thing you’re capturing, such as hover, then it’s sort of right. But if you want to check what the header looks like before and after clicking on a button, that’s when these will be different.
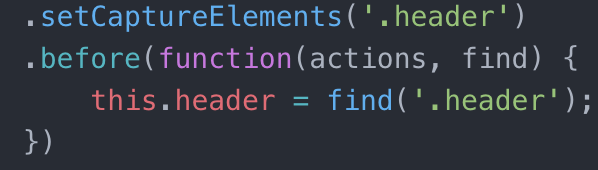
The first line sets what area will be screenshotted. In this example, I want to screenshot the entire header area of my practice site. This is the area that will be screenshotted in every instance within this test suite – I can screenshot the header once, then hover over it and screenshot it again etc.
The second line, which starts with “.before”, tells the computer that before it tries to take a screenshot, it needs to find a certain element. In this case, it finds the .header section of the site. So the first line sets which element will be screenshotted, and the second defines an area of the site you would want to interact with in your test.
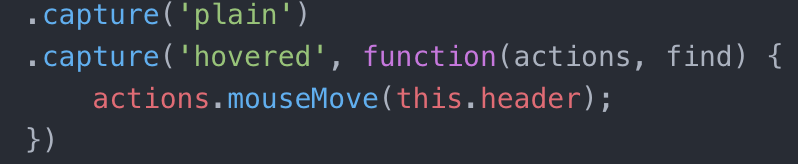
The lines that start with “.capture” are where the screenshotting actually happens. The first capture (‘plain’) means that the test takes a screenshot of the header without having done anything to it first. The second capture takes a screenshot while the header is being hovered on.
When capturing screenshots there are a bunch of actions you can take, for example clicking or moving the mouse over an object, or even typing in a box. These can be done by using a one or more statements that look like “actions.<actionType>(on this element);” in sequence. In the above example, the function basically says “move the mouse to the middle of ‘this.header’, which was set earlier to be ‘find(‘.header’)’ and then take the screenshot.”
And that’s it! That’s the test written! In order to take your first set of screenshots, use the command:
gemini update <path to test file>
Make sure you have read through the documentation properly and have everything you need to run the test in terms of packages and dependencies. I used selenium-standalone to run mine because it’s faster to set up than phantomJS. This means that in addition to the node app.js command running in terminal, I also need to have selenium-standalone start running in another tab. Then I can run the test commands in a third tab. This is combersome, and I might set up a custom command that starts the two processes and then runs the test without me having to do all of that manually each time, if I have time in the future.
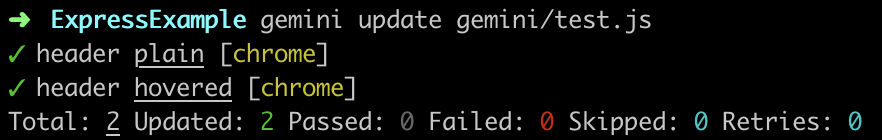
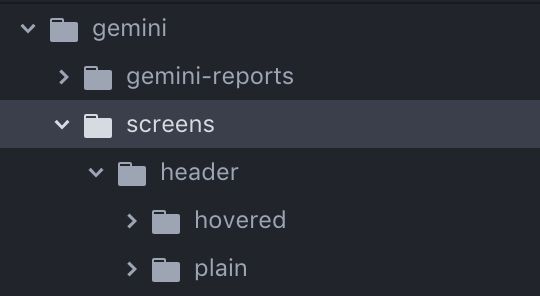
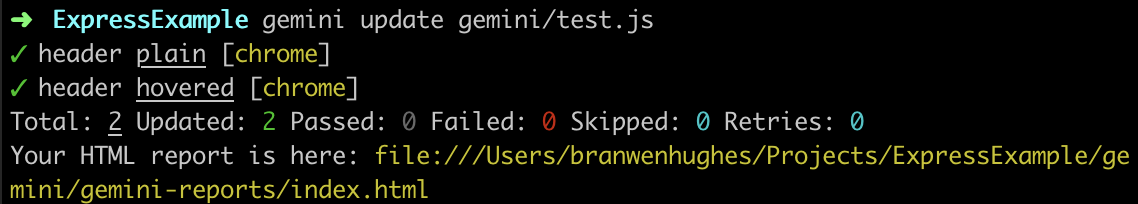
After running the gemini update command, so long as everything is fine, you will get the above printed in your terminal. It shows that both of the tests passed (‘plain’ and ‘hovered’), but it doesn’t actually show the screenshots or where to find them. If you go back to your text editor and look in your project however, you will see that there is now a folder called “Screens”. Inside here you will find the images themselves.
This is not a very good way to look at and compare images for before-and-after though! Back to that in a second.
In order to make new screenshots to compare with, you run the command:
gemini test <path to test file>
If the tests say they passed then the images are the same as before. If the tests say they failed then something has changed. You get no other indication or comparison, which is not useful. To see the images, you have to go into your project and find them yourself. If only there was some way of having them laid out for you in one place…
Using html-reporter
There is a package built just for this purpose! It’s called html-reporter. The documentation is here, which has installation instructions. Simply install the package into your project through npm and copy-paste the plugin from the “Gemini Usage” section of the readme into your gemini config file so that it looks something like this:
After that, when you run the test in terminal again, you will get a link to a html file you can copy into your browser:
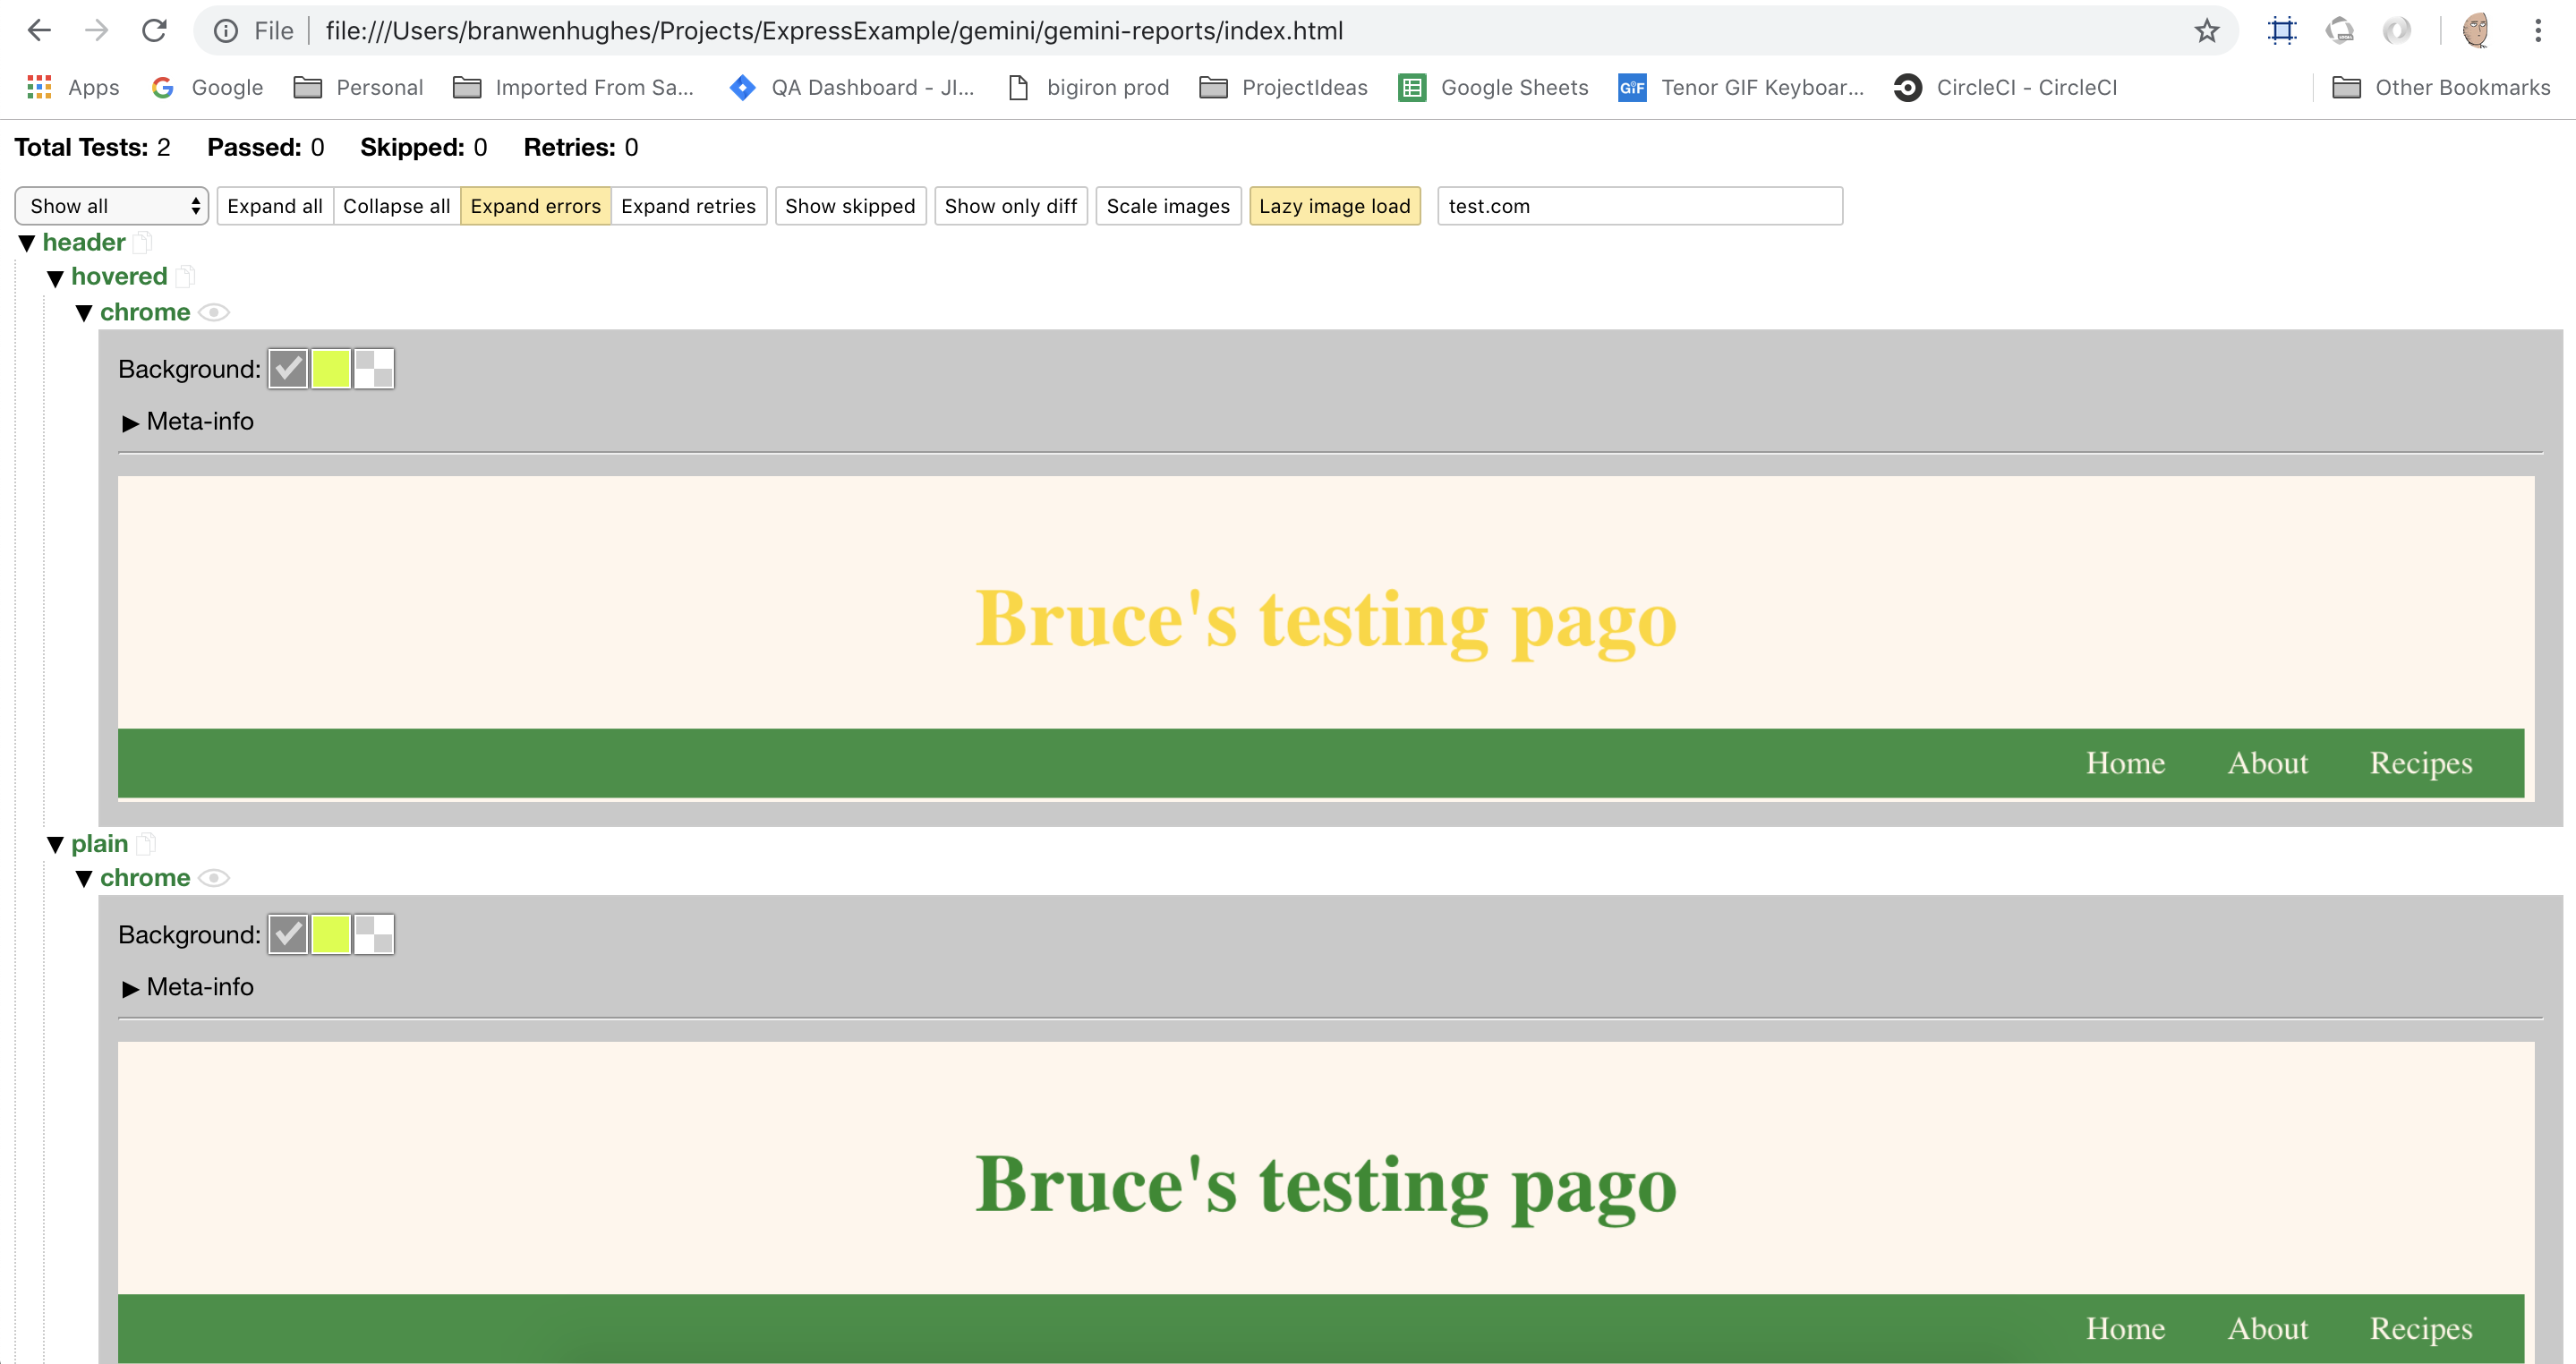
I added a hover state to my header so that there would be something to look at, but you can see that there is a dropdown called “header”, which has the two options “hovered” and “plain”. In the hovered screenshot, the header text is gold so I know the mouseMove method worked.
Now that there are base screenshots, we can make a change to run against them and see if the test fails as expected. You might have noticed the typo in my header text, so I’ll go ahead and fix that now.
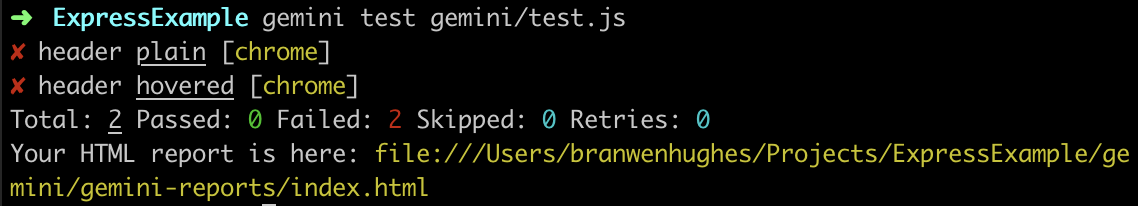
As expected, it says that two tests failed. A failed test means that something has changed, so new screenshots don’t match the originals we set using the gemini update command. Thanks to the html-reporter we can actually see what failed and why, instead of seeing the tests failing but not knowing why. For all we know at this point, the failure is because the page failed to load and it couldn’t find the header.
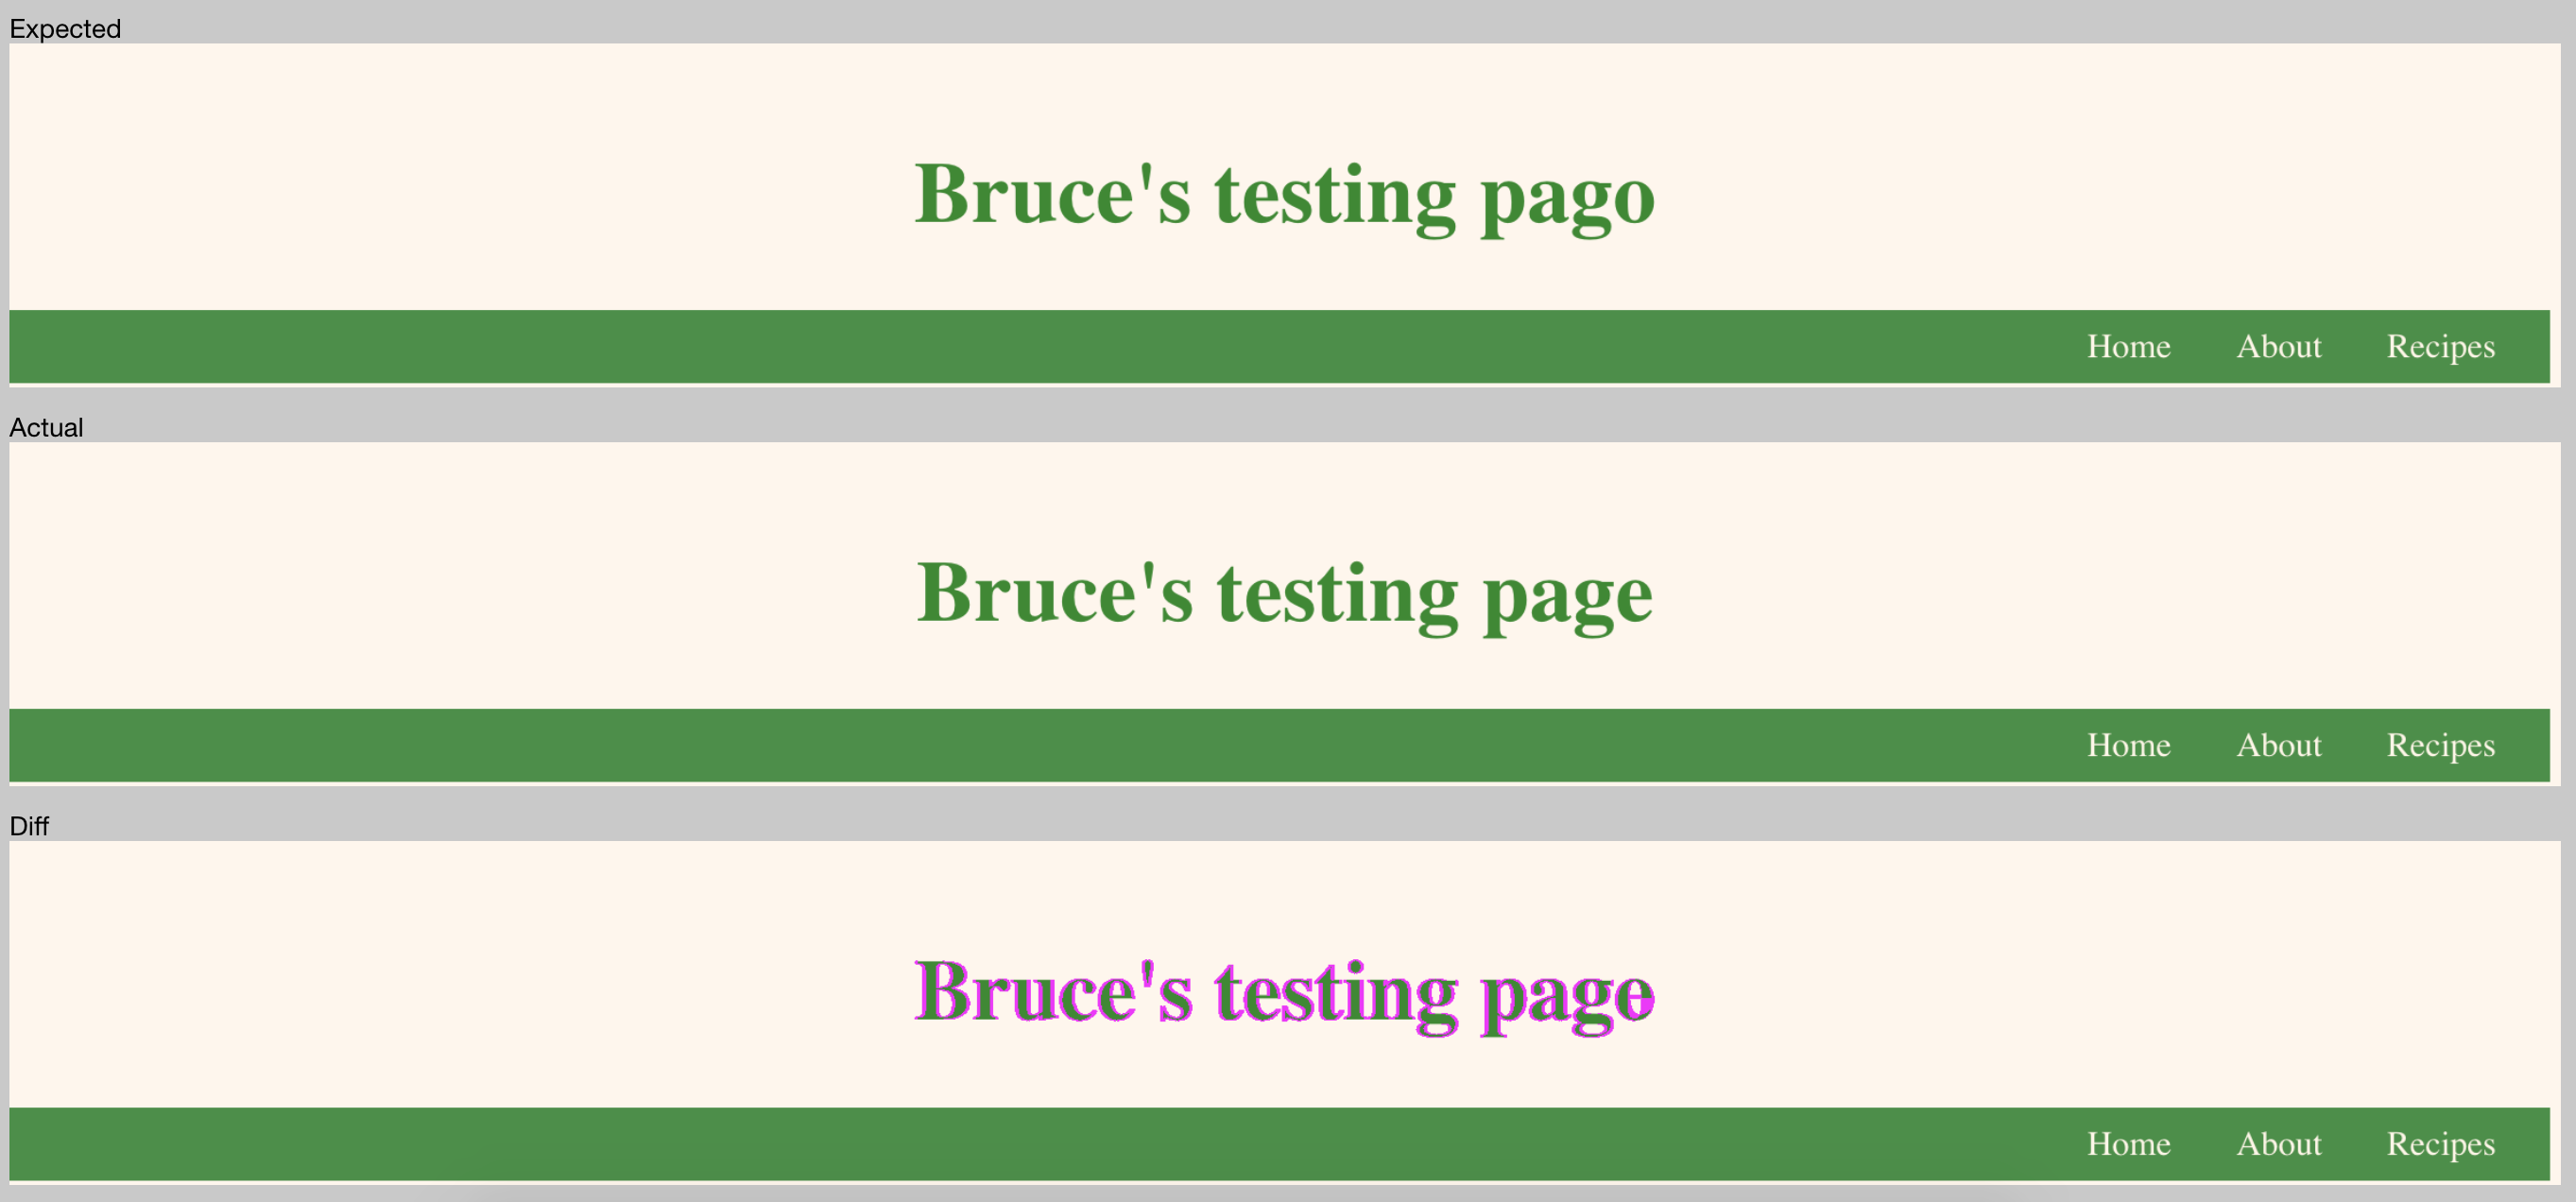
In the html reporter we can now see the ‘Expected’ header, ie the screenshot we set earlier, followed by the ‘Actual’ which is what is now showing. Lastly is the ‘Diff’, which highlights in pink everything that’s different between them. Since I didn’t set a tolerance level, it’s highlighting everything instead of the o->e change, but you get the drift. It’s super cool.
From here
I’m going to experiment with writing a few more vrts for the experiment site – one that clicks from page to page, and one that checks different radios on the Saitama cube and sees if the face has changed. I’m learning all of this on my own, so I’m bound to have made many mistakes, and to make many more. This post was written after the fact, so doesn’t have any of the numberous blunders or times spent trawling the docs because I couldn’t work out why I was getting this or that error – or failure with no error.
I’d also like to check out Puppeteer, which is a google-made API that lets you control Chrome. I’d have to find another way of taking screenshots, and maybe even write my own code for an app to compare two screenshots. This is a big undertaking though, so I’m not sure that I will have the time to work it all out.
Hopefully I will have the time to write a further post about the other two small VRTs I have planned anyway. 🙂
